This function creates a ggplot2 layer that can be added with + to apply
both theme styling (using element_textbox_simple from ggtext) and branded
captions to your ggplot2 charts.
Usage
add_branding(
  github = NULL,
  gitlab = NULL,
  linkedin = NULL,
  bluesky = NULL,
  twitter = NULL,
  mastodon = NULL,
  orcid = NULL,
  email = NULL,
  website = NULL,
  custom_icons = NULL,
  additional_text = NULL,
  text_position = "before",
  line_spacing = 1L,
  icon_color = "#666666",
  text_color = "#333333",
  icon_size = "8pt",
  text_size = "8pt",
  line_height = "1.2",
  text_family = NULL,
  additional_text_color = NULL,
  additional_text_size = NULL,
  setup_fonts = TRUE,
  caption_width = NULL,
  caption_halign = 0,
  caption_margin = NULL
)
Arguments
- github
(
NULL | character(1)) GitHub username (optional)- gitlab
(
NULL | character(1)) GitLab username (optional)(
NULL | character(1)) LinkedIn username (optional)- bluesky
(
NULL | character(1)) Bluesky handle (optional)(
NULL | character(1)) Twitter/X handle (optional)- mastodon
(
NULL | character(1)) Mastodon handle (optional)- orcid
(
NULL | character(1)) ORCID ID (optional)(
NULL | character(1)) Email address (optional)- website
(
NULL | character(1)) Website URL (optional)- custom_icons
(
NULL | character) Named vector of additional icon names and usernames (optional). Names should match icons from icons_df.- additional_text
(
NULL | character(1)) Additional text to include in caption (e.g., "Data source: XYZ")- text_position
(
character(1)) Position of additional text relative to branding. Either "before" or "after". (default: "before")- line_spacing
(
integer(1)) Number of line breaks between additional text and icons (1-3). (default: 1)- icon_color
(
character(1)) Color for icons. (default: "#666666")- text_color
(
character(1)) Color for usernames/text. (default: "#333333")- icon_size
(
character(1)) Font size for icons. (default: "8pt")- text_size
(
character(1)) Font size for text/usernames. (default: "8pt")- line_height
(
character(1)) Line height for the caption. (default: "1.2")- text_family
(
NULL | character(1)) Font family for text/usernames. (default: NULL uses system default)- additional_text_color
(
NULL | character(1)) Color for additional text. If NULL, uses text_color. (default: NULL)- additional_text_size
(
NULL | character(1)) Font size for additional text. If NULL, uses text_size. (default: NULL)- setup_fonts
(
logical(1)) Whether to automatically setup Font Awesome fonts. (default: TRUE)- caption_width
(
NULL | character(1)) Width specification for caption text box (default: NULL uses ggtext default)- caption_halign
(
numeric(1)) Horizontal alignment for caption (0 = left, 0.5 = center, 1 = right). (default: 0)- caption_margin
(
NULL | ggplot2::margin) Margin specification for caption (default: NULL uses ggtext default)
Examples
# \donttest{
library(ggplot2)
library(ggtext)
library(ggbranding)
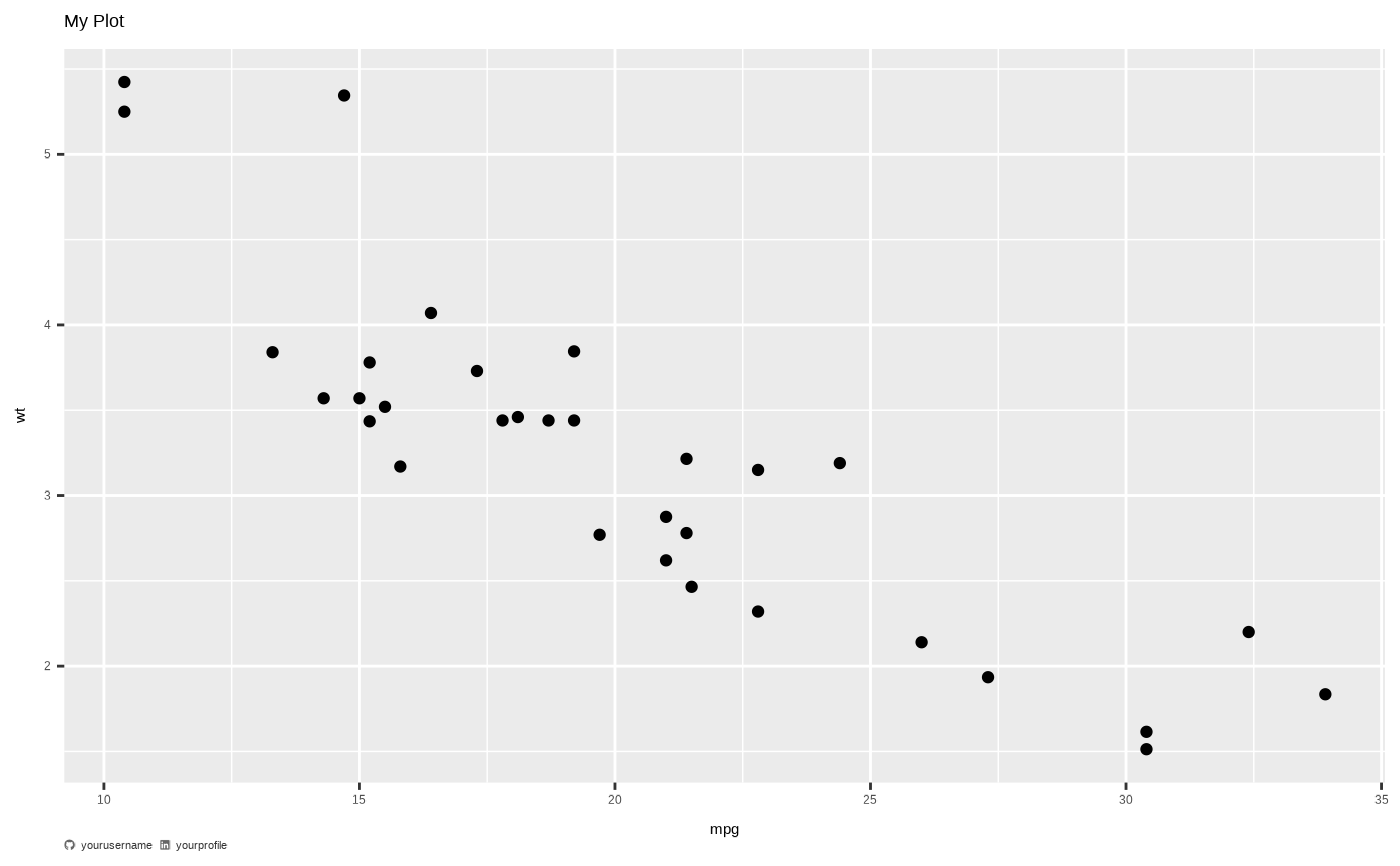
# Use with + in ggplot chain
ggplot(mtcars, aes(x = mpg, y = wt)) +
geom_point() +
labs(title = "My Plot") +
add_branding(
github = "yourusername",
linkedin = "yourprofile"
)
#> Created font cache directory at: ~/.cache/ggbranding
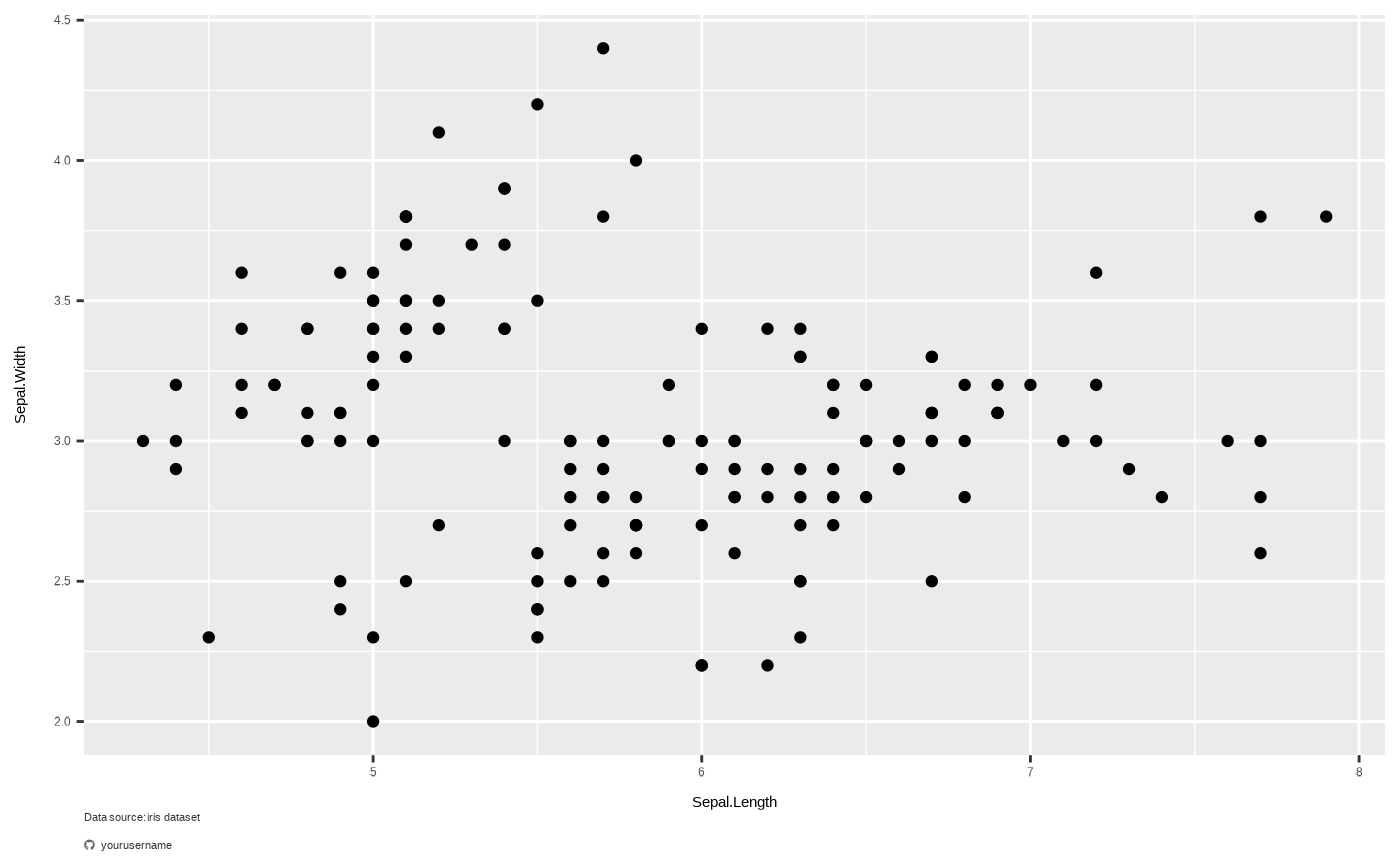
 # With additional text
ggplot(iris, aes(x = Sepal.Length, y = Sepal.Width)) +
geom_point() +
add_branding(
github = "yourusername",
additional_text = "Data source: iris dataset",
text_position = "before"
)
# With additional text
ggplot(iris, aes(x = Sepal.Length, y = Sepal.Width)) +
geom_point() +
add_branding(
github = "yourusername",
additional_text = "Data source: iris dataset",
text_position = "before"
)
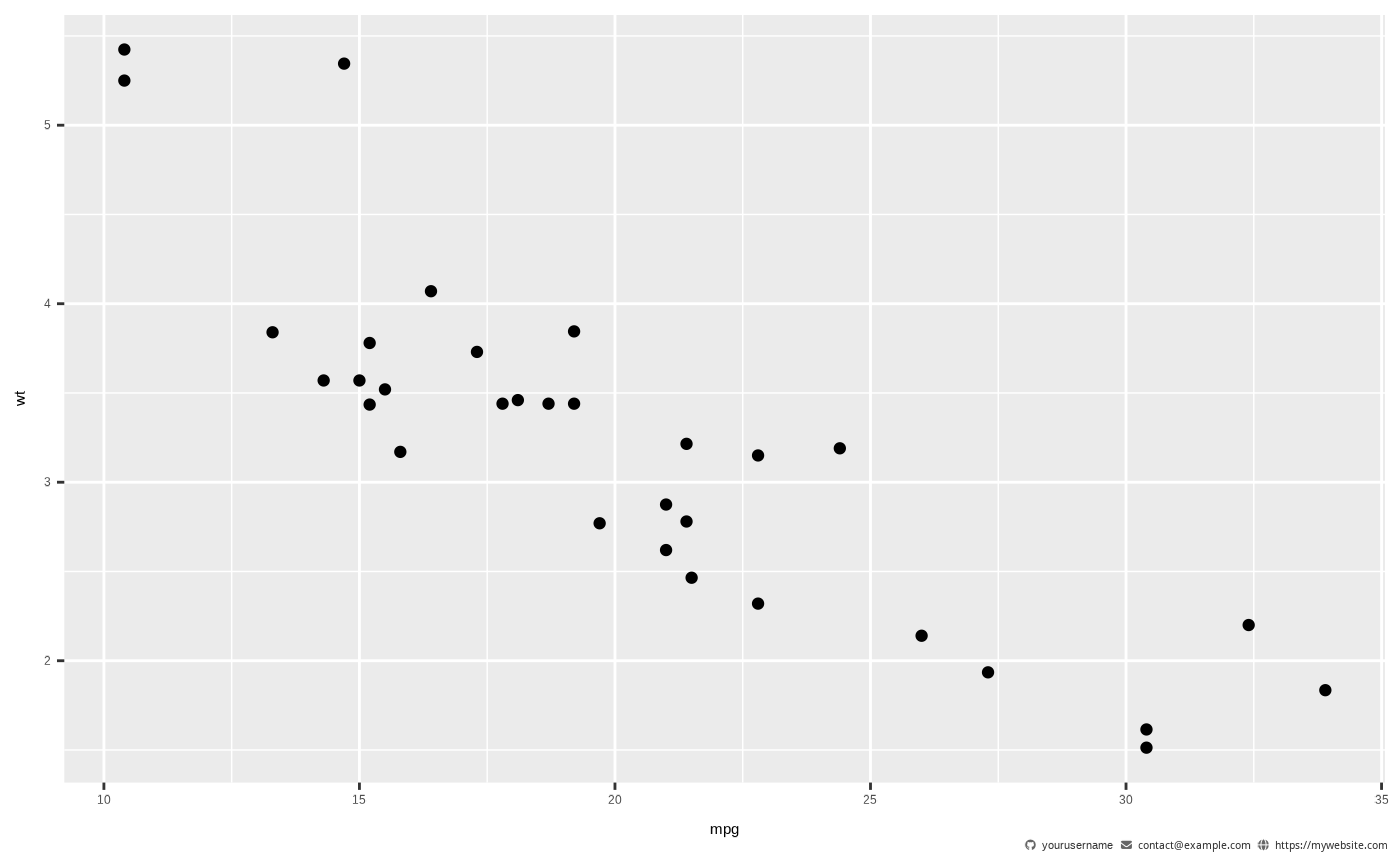
 # With custom icons and styling
ggplot(mtcars, aes(x = mpg, y = wt)) +
geom_point() +
add_branding(
github = "yourusername",
custom_icons = c(
envelope = "contact@example.com",
globe = "https://mywebsite.com"
),
caption_halign = 1
)
# With custom icons and styling
ggplot(mtcars, aes(x = mpg, y = wt)) +
geom_point() +
add_branding(
github = "yourusername",
custom_icons = c(
envelope = "contact@example.com",
globe = "https://mywebsite.com"
),
caption_halign = 1
)
 # }
# }