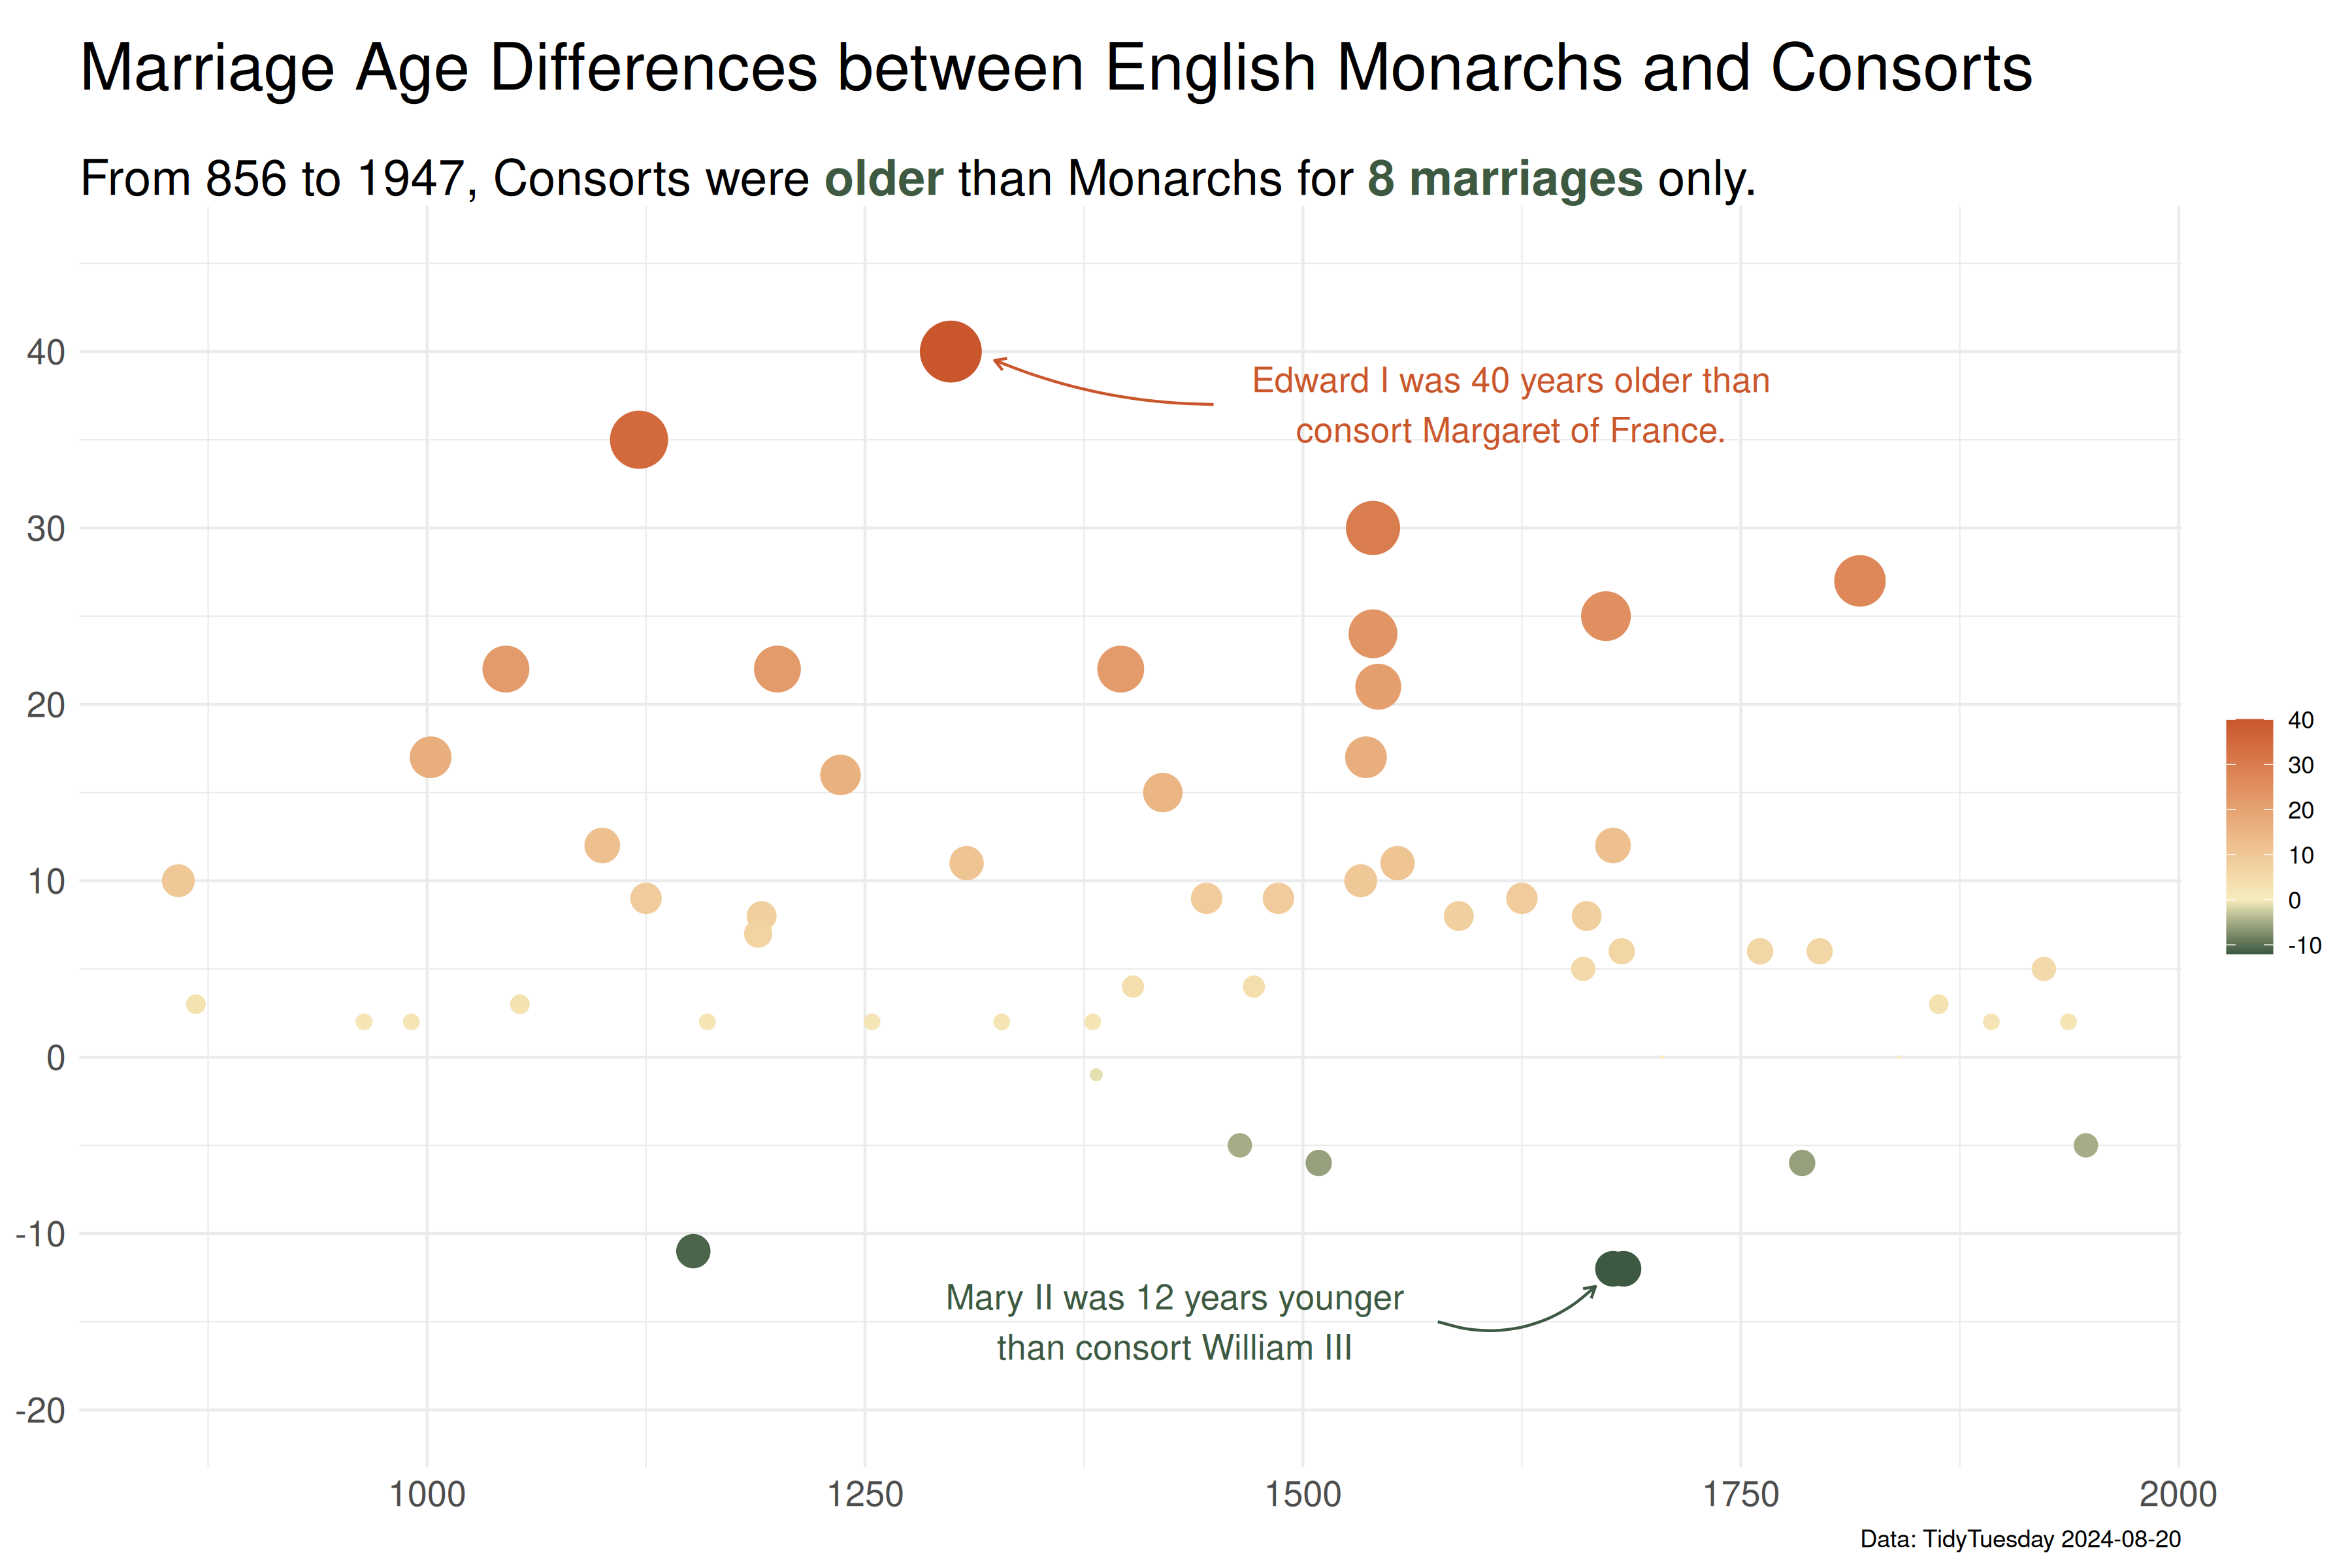
English Monarchs Marriages

TidyTuesday Week 34

r
ggplot2
tidyverse
history
Author

gnoblet

Published

August 20, 2024

Overview

This week’s TidyTuesday explored marriage data of English monarchs, analyzing age differences between kings and their consorts over time. The visualization reveals fascinating patterns in royal marriage dynamics from medieval times to the modern era.

Dataset

The dataset contains marriage information for English monarchs including: - King and consort ages at marriage - Year of marriage - Names of monarchs and consorts

Source: TidyTuesday English Monarchs Marriages

Analysis

Data Preparation

Code
# Get data
df <- readr::read_csv('https://raw.githubusercontent.com/rfordatascience/tidytuesday/master/data/2024/2024-08-20/english_monarchs_marriages_df.csv')

# Convert variables to numeric
df <- dyr$mutate(
  df,
  dyr$across(
    c(king_age, consort_age, year_of_marriage),
    as.numeric
  )
)

# Calculate age difference (positive = king older, negative = consort older)
df <- dyr$mutate(df, age_diff = king_age - consort_age)

# Basic statistics
older_consorts <- dyr$filter(df, age_diff < 0) |> nrow()
total_marriages <- nrow(df)

Key Statistics

Code
# Get extremes
max_diff <- max(df$age_diff, na.rm = TRUE)
min_diff <- min(df$age_diff, na.rm = TRUE)
max_year <- max(df$year_of_marriage, na.rm = TRUE)
min_year <- min(df$year_of_marriage, na.rm = TRUE)

# Find specific cases
max_case <- df[which.max(df$age_diff), ]
min_case <- df[which.min(df$age_diff), ]

cat("Marriage Analysis Summary:\n")
Marriage Analysis Summary:
Code
cat("- Total marriages analyzed:", total_marriages, "\n")
- Total marriages analyzed: 83 
Code
cat("- Marriages where consort was older:", older_consorts, "\n")
- Marriages where consort was older: 8 
Code
cat("- Time period:", min_year, "to", max_year, "\n")
- Time period: 856 to 1947 
Code
cat("- Largest age gap (king older):", max_diff, "years\n")
- Largest age gap (king older): 40 years
Code
cat("- Largest age gap (consort older):", abs(min_diff), "years\n")
- Largest age gap (consort older): 12 years

Visualization

Code
g <- gg$ggplot(df) + 
  gg$geom_point(
    gg$aes(
      x = year_of_marriage,
      y = age_diff,
      color = age_diff, 
      size = abs(age_diff)
    )
  ) +
  gg$scale_size_area(max_size = 10) +
  gg$scale_color_gradientn(
    colors = c("#3d5941", "#f6edbd", "#ca562c"),
    values = scales::rescale(c(-12, 0, 40)),
    limits = c(-12, 40)
  ) +
  # Annotation for maximum age difference
  gg$annotate(
    geom = "text",
    x = max_case$year_of_marriage + 320,
    y = max_diff - 3,
    label = sgr$str_wrap(paste0(max_case$king_name, " was ", abs(max_diff), 
                               " years older than consort ", max_case$consort_name, ". "), 35),
    color = "#ca562c",
    size = 4.5,
    hjust = 0.5
  ) +
  gg$annotate(
    geom = "curve",
    x = max_case$year_of_marriage + 150,
    y = max_diff - 3,
    xend = max_case$year_of_marriage + 25,
    yend = max_diff - 0.5,
    color = "#ca562c",
    arrow = gg$arrow(length = gg$unit(0.01, "npc")), 
    curvature = -0.1
  ) +
  # Annotation for minimum age difference  
  gg$annotate(
    geom = "text",
    x = min_case$year_of_marriage - 250,
    y = min_diff - 3,
    label = sgr$str_wrap(paste0(min_case$king_name, " was ", abs(min_diff), 
                               " years younger than consort ", min_case$consort_name), 30),
    color = "#3d5941",
    size = 4.5,
    hjust = 0.5
  ) +
  gg$annotate(
    geom = "curve",
    x = min_case$year_of_marriage - 100,
    y = min_diff - 3,
    xend = min_case$year_of_marriage - 10,
    yend = min_diff - 1,
    color = "#3d5941",
    curvature = 0.3,
    arrow = gg$arrow(length = gg$unit(0.01, "npc"))
  ) +
  gg$guides(size = "none") +
  gg$labs(
    x = "Year of Marriage",
    y = "Age Difference (Years)",
    title = "Marriage Age Differences between English Monarchs and Consorts",
    subtitle = sgr$str_wrap(paste0("From ", min_year, " to ", max_year, 
                                  ", Consorts were ", "<b><span style='color:#3d5941'>older</span></b>", 
                                  " than Monarchs for ", "<b><span style='color:#3d5941'>", 
                                  older_consorts, " marriages</span></b> only."), 75),
    caption = "Data: TidyTuesday 2024-08-20"
  ) + 
  gghrbr$theme_ipsum_rc(base_size = 14) +
  gg$scale_y_continuous(breaks = seq(-20, 40, 10), limits = c(-20, 45)) +
  gg$theme_minimal() +
  gg$theme(
    plot.background = gg$element_rect(fill = 'white', color = NA), 
    legend.title = gg$element_blank(),
    axis.title.y = gg$element_blank(),
    axis.title.x = gg$element_blank(),
    axis.text = gg$element_text(size = 13),
    plot.title = ggt$element_textbox_simple(size = 24, margin = gg$margin(b = 20, t = 10)),
    plot.subtitle = ggt$element_textbox_simple(size = 18)
  )

Save

Code
gg$ggsave('week_34.png', g, width = 12, height = 8)

Technical Notes

  • Used diverging color scale to highlight positive vs negative age differences
  • Point size represents magnitude of age difference
  • Annotations highlight the most extreme cases
  • Data spans from 856 to 1947

Viz