This week’s TidyTuesday focused on democracy data, exploring which countries are considered democratic over time. I created interactive world maps using Python to visualize the evolution of democratic states from 1950 to the present.
Dataset
The dataset contains information about democracy classifications for countries worldwide, spanning from 1950 to recent years. Each country is classified as democratic or non-democratic for each year.
# Get world countries geojsonimport geopandas as gpdworld = gpd.read_file('https://datahub.io/core/geo-countries/_r/-/data/countries.geojson')print(f"World geometries: {len(world)} countries")print(f"Available columns: {world.columns.tolist()}")print(f"Sample of country codes: {world['ISO_A3'].head().tolist() if'ISO_A3'in world.columns else'ISO_A3 not found'}")
World geometries: 258 countries
Available columns: ['name', 'ISO3166-1-Alpha-3', 'ISO3166-1-Alpha-2', 'geometry']
Sample of country codes: ISO_A3 not found
Data Joining Function
Code
# Function that left joins DataFrame and GeoDataFramedef left_join_gdf(df, gdf, key_df, key_gdf, how='left'):""" Join democracy data with world geometries """return pd.merge(df, gdf, left_on=key_df, right_on=key_gdf, how=how).set_geometry('geometry')# Check available country code columnsprint("Democracy data country codes sample:", df['country_code'].head().tolist())print("World data columns:", [col for col in world.columns if'ISO'in col or'CODE'in col or col in ['ADMIN', 'NAME']])# Find the appropriate ISO3 columniso3_columns = [col for col in world.columns if'ISO'in col and'3'in col]print(f"Available ISO3 columns: {iso3_columns}")# Use the first available ISO3 columnif iso3_columns: country_col = iso3_columns[0] # Should be 'ISO3166-1-Alpha-3'else:# Fallback to first column that might contain country codes potential_cols = [col for col in world.columns ifany(term in col.upper() for term in ['ISO', 'CODE', 'ADMIN', 'NAME'])] country_col = potential_cols[0] if potential_cols else world.columns[0]print(f"Using column: {country_col}")# Join democracy data with world geometriesdf_shp = left_join_gdf( df, world, key_df='country_code', key_gdf=country_col, how='left')print(f"Joined dataset shape: {df_shp.shape}")print(f"Countries with geometry: {df_shp['geometry'].notna().sum()}")
Democracy data country codes sample: ['AFG', 'AFG', 'AFG', 'AFG', 'AFG']
World data columns: ['ISO3166-1-Alpha-3', 'ISO3166-1-Alpha-2']
Available ISO3 columns: ['ISO3166-1-Alpha-3', 'ISO3166-1-Alpha-2']
Using column: ISO3166-1-Alpha-3
Joined dataset shape: (14768, 47)
Countries with geometry: 14342
Visualization Setup
Code
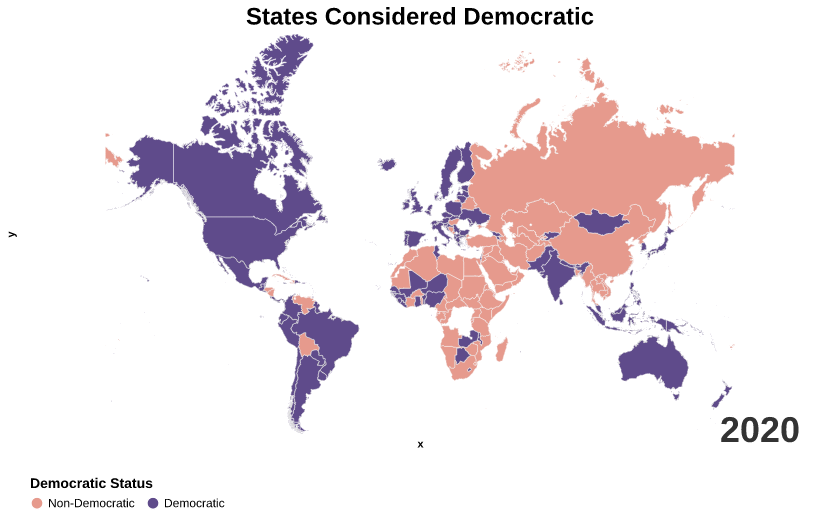
import altair as alt# Color scheme for democracy statuscol1 ='#5F4B8BFF'# Democracycol2 ='#E69A8DFF'# Non-democracy col3 ='#4c4b4c'# No data# Focus on a specific year for detailed analysisyear =2020df_to_alt = df_shp[df_shp['year'] == year].copy()print(f"Data for {year}: {len(df_to_alt)} records")print(f"Democratic countries in {year}: {df_to_alt['is_democracy'].sum()}")
Data for 2020: 208 records
Democratic countries in 2020: 129
Interactive Map Creation
Code
# Note: The 2020 chart will be created as part of the GIF generation# and saved as week_45.png (the last frame)
Animated GIF Creation
Create individual charts for each year:
Code
import osimport imageiofrom PIL import Imageimport numpy as np# Create temporary directory for individual frames inside the current directorytemp_dir ='temp_frames'ifnot os.path.exists(temp_dir): os.makedirs(temp_dir)# Get all available years and sort themyears =sorted(df['year'].unique())print(f"Creating GIF for years: {years[0]} - {years[-1]} ({len(years)} years)")# Create individual charts for each yearframe_paths = []for i, year inenumerate(years):print(f"Processing year {year} ({i+1}/{len(years)})")# Filter data for current year df_year = df_shp[df_shp['year'] == year].copy()# Create base map chart base_chart = alt.Chart( df_year, title=alt.Title('States Considered Democratic', fontSize=24 ) ).mark_geoshape( stroke='white', strokeWidth=0.5 ).encode( color=alt.Color('is_democracy:N', scale=alt.Scale( domain=[False, True],range=['#E69A8DFF', '#5F4B8BFF'] ), legend=alt.Legend( title='Democratic Status', labelExpr="datum.value ? 'Democratic' : 'Non-Democratic'", direction='horizontal', orient='bottom', titleFontSize=14, labelFontSize=12, symbolSize=150, padding=10 ) ), tooltip=[ alt.Tooltip('ADMIN:N', title='Country'), alt.Tooltip('is_democracy:N', title='Democratic'), alt.Tooltip('year:O', title='Year') ] ).properties( width=800, height=400 )# Create year text overlay year_text = alt.Chart( alt.InlineData(values=[{'year': str(year), 'x': 780, 'y': 20}]) ).mark_text( align='right', baseline='top', fontSize=36, fontWeight='bold', color='#333333' ).encode( x=alt.X('x:Q', scale=alt.Scale(domain=[0, 800])), y=alt.Y('y:Q', scale=alt.Scale(domain=[0, 400])), text=alt.Text('year:N') )# Combine the map and year text, then apply configurations year_chart = alt.layer(base_chart, year_text).configure_view( strokeWidth=0 ).configure_axis( grid=False ).configure_axisX( labels=False, ticks=False, domain=False ).configure_axisY( labels=False, ticks=False, domain=False )# Save individual frame frame_path =f'{temp_dir}/frame_{year}.png' year_chart.save(frame_path) frame_paths.append(frame_path)# Save the last frame (most recent year) as the main thumbnailif year == years[-1]: year_chart.save('week_45.png')print(f"Saved {year} chart as week_45.png (thumbnail)")print(f"Created {len(frame_paths)} frames")
Create GIF from individual frames:
Code
# Create GIF from individual framesimages = []for frame_path in frame_paths:if os.path.exists(frame_path): img = Image.open(frame_path) images.append(img)# Save as GIFgif_path ='week_45.gif'if images: images[0].save( gif_path, save_all=True, append_images=images[1:], duration=500, # 500ms per frame loop=0 )print(f"GIF saved as: {gif_path}")print(f"GIF contains {len(images)} frames")else:print("No images found to create GIF")# Clean up temporary framesimport shutilif os.path.exists(temp_dir): shutil.rmtree(temp_dir)print("Cleaned up temporary frames")