# Load required packageslibrary(owidapi)library(stringr)library(data.table)library(ggplot2)library(ggtext)library(paletteer)library(scales)# get dataids <-c('wheat-production', 'rice-production', 'maize-production')l_dat <-list()for (id in ids) { l_dat[[id]] <-owid_get(chart_id = id)# fourth column rename to 'tonnes'colnames(l_dat[[id]])[4] <-"tonnes"setDT(l_dat[[id]])names(l_dat)[length(l_dat)] <- id}dat <-rbindlist(l_dat, idcol ="production")# remove non countryentity_to_rm <-c('World','Americas (FAO)','High-income countries','North America','Upper-middle-income countries','Asia','Eastern Asia (FAO)','China (FAO)','Europe (FAO)','South America (FAO)','South America','Lower-middle-income countries','European Union (27) (FAO)','European Union (27)','Africa (FAO)','Africa','Eastern Europe (FAO)','Net Food Importing Developing Countries (FAO)','Low Income Food Deficit Countries (FAO)','Least Developed Countries (FAO)','Southern Europe (FAO)','Net Food Importing Developing Countries (FAO)','Low Income Food Deficit Countries (FAO)','Least Developed Countries (FAO)','Southern Europe (FAO)','South-eastern Asia (FAO)','Central America (FAO)','Southern Asia (FAO)','Land Locked Developing Countries (FAO)','Eastern Africa (FAO)','Western Europe (FAO)','Low-income countries','Southern Africa (FAO)','Western Africa (FAO)','Western Asia (FAO)','Middle Africa (FAO)','Northern Africa (FAO)','Small Island Developing States (FAO)','Caribbean (FAO)','Oceania (FAO)','Central Asia (FAO)','Northern Europe (FAO)','Belgium-Luxembourg (FAO)','Asia (FAO)','Northern America (FAO)','Europe','Micronesia (FAO)')dat <- dat[!entity_name %in% entity_to_rm]# sum group by entity_name and yeardat_sum <- dat[,lapply(.SD, function(x) sum(x, na.rm =TRUE)), .SDcols =c("tonnes"), by = .(production, year)]maxmin <-range(dat_sum$tonnes, na.rm = T)m <-mean(dat_sum$tonnes, na.rm = T)# plot geom_tileg <-ggplot(dat_sum, aes(x = year, y =1, fill = tonnes)) +geom_tile() +facet_wrap(~production,nrow =3,labeller =labeller(production =c("rice-production"="Rice","wheat-production"="Wheat","maize-production"="Maize" ) ) ) +scale_fill_paletteer_c("scico::bam",direction =-1,labels =label_number(scale_cut =cut_short_scale() ) ) +labs(title ="<span style='color:#333333; font-size:19pt; font-weight:700'>Global Yearly Production of Rice, Wheat, and Maize</span><br><br><span style='color:#333333; font-size:19pt'>From 1950 to 2020 in Billion of Tonnes",caption ="Data: Our World in Data | Viz: @gnoblet" ) +theme_minimal() +theme(axis.text.x =element_text(size =13,color ="gray20" ),axis.text.y =element_blank(),axis.line.y =element_blank(),axis.title =element_blank(),panel.grid =element_blank(),legend.position ='top',legend.title =element_blank(),legend.text =element_text(size =13,color ="gray20" ),legend.key.width =unit(5, "lines"),plot.title =element_textbox_simple(size =13,hjust =0.5,halign =0.5,width =0.8,padding =margin(b =30, t =20, l =10, r =10), ),plot.caption =element_text(hjust =0,size =12,color ="gray20",margin =margin(t =30) ),strip.text =element_text(hjust =0.1,size =15,color ="gray20",margin =margin(r =15) ),strip.placement ="outside",plot.background =element_rect(fill ="white",color =NA ),panel.background =element_rect(fill ="white",color =NA ) )ggsave("day_11.png", g,dpi =600,width =9,height =10,units ="in")
Final Plot
Notes
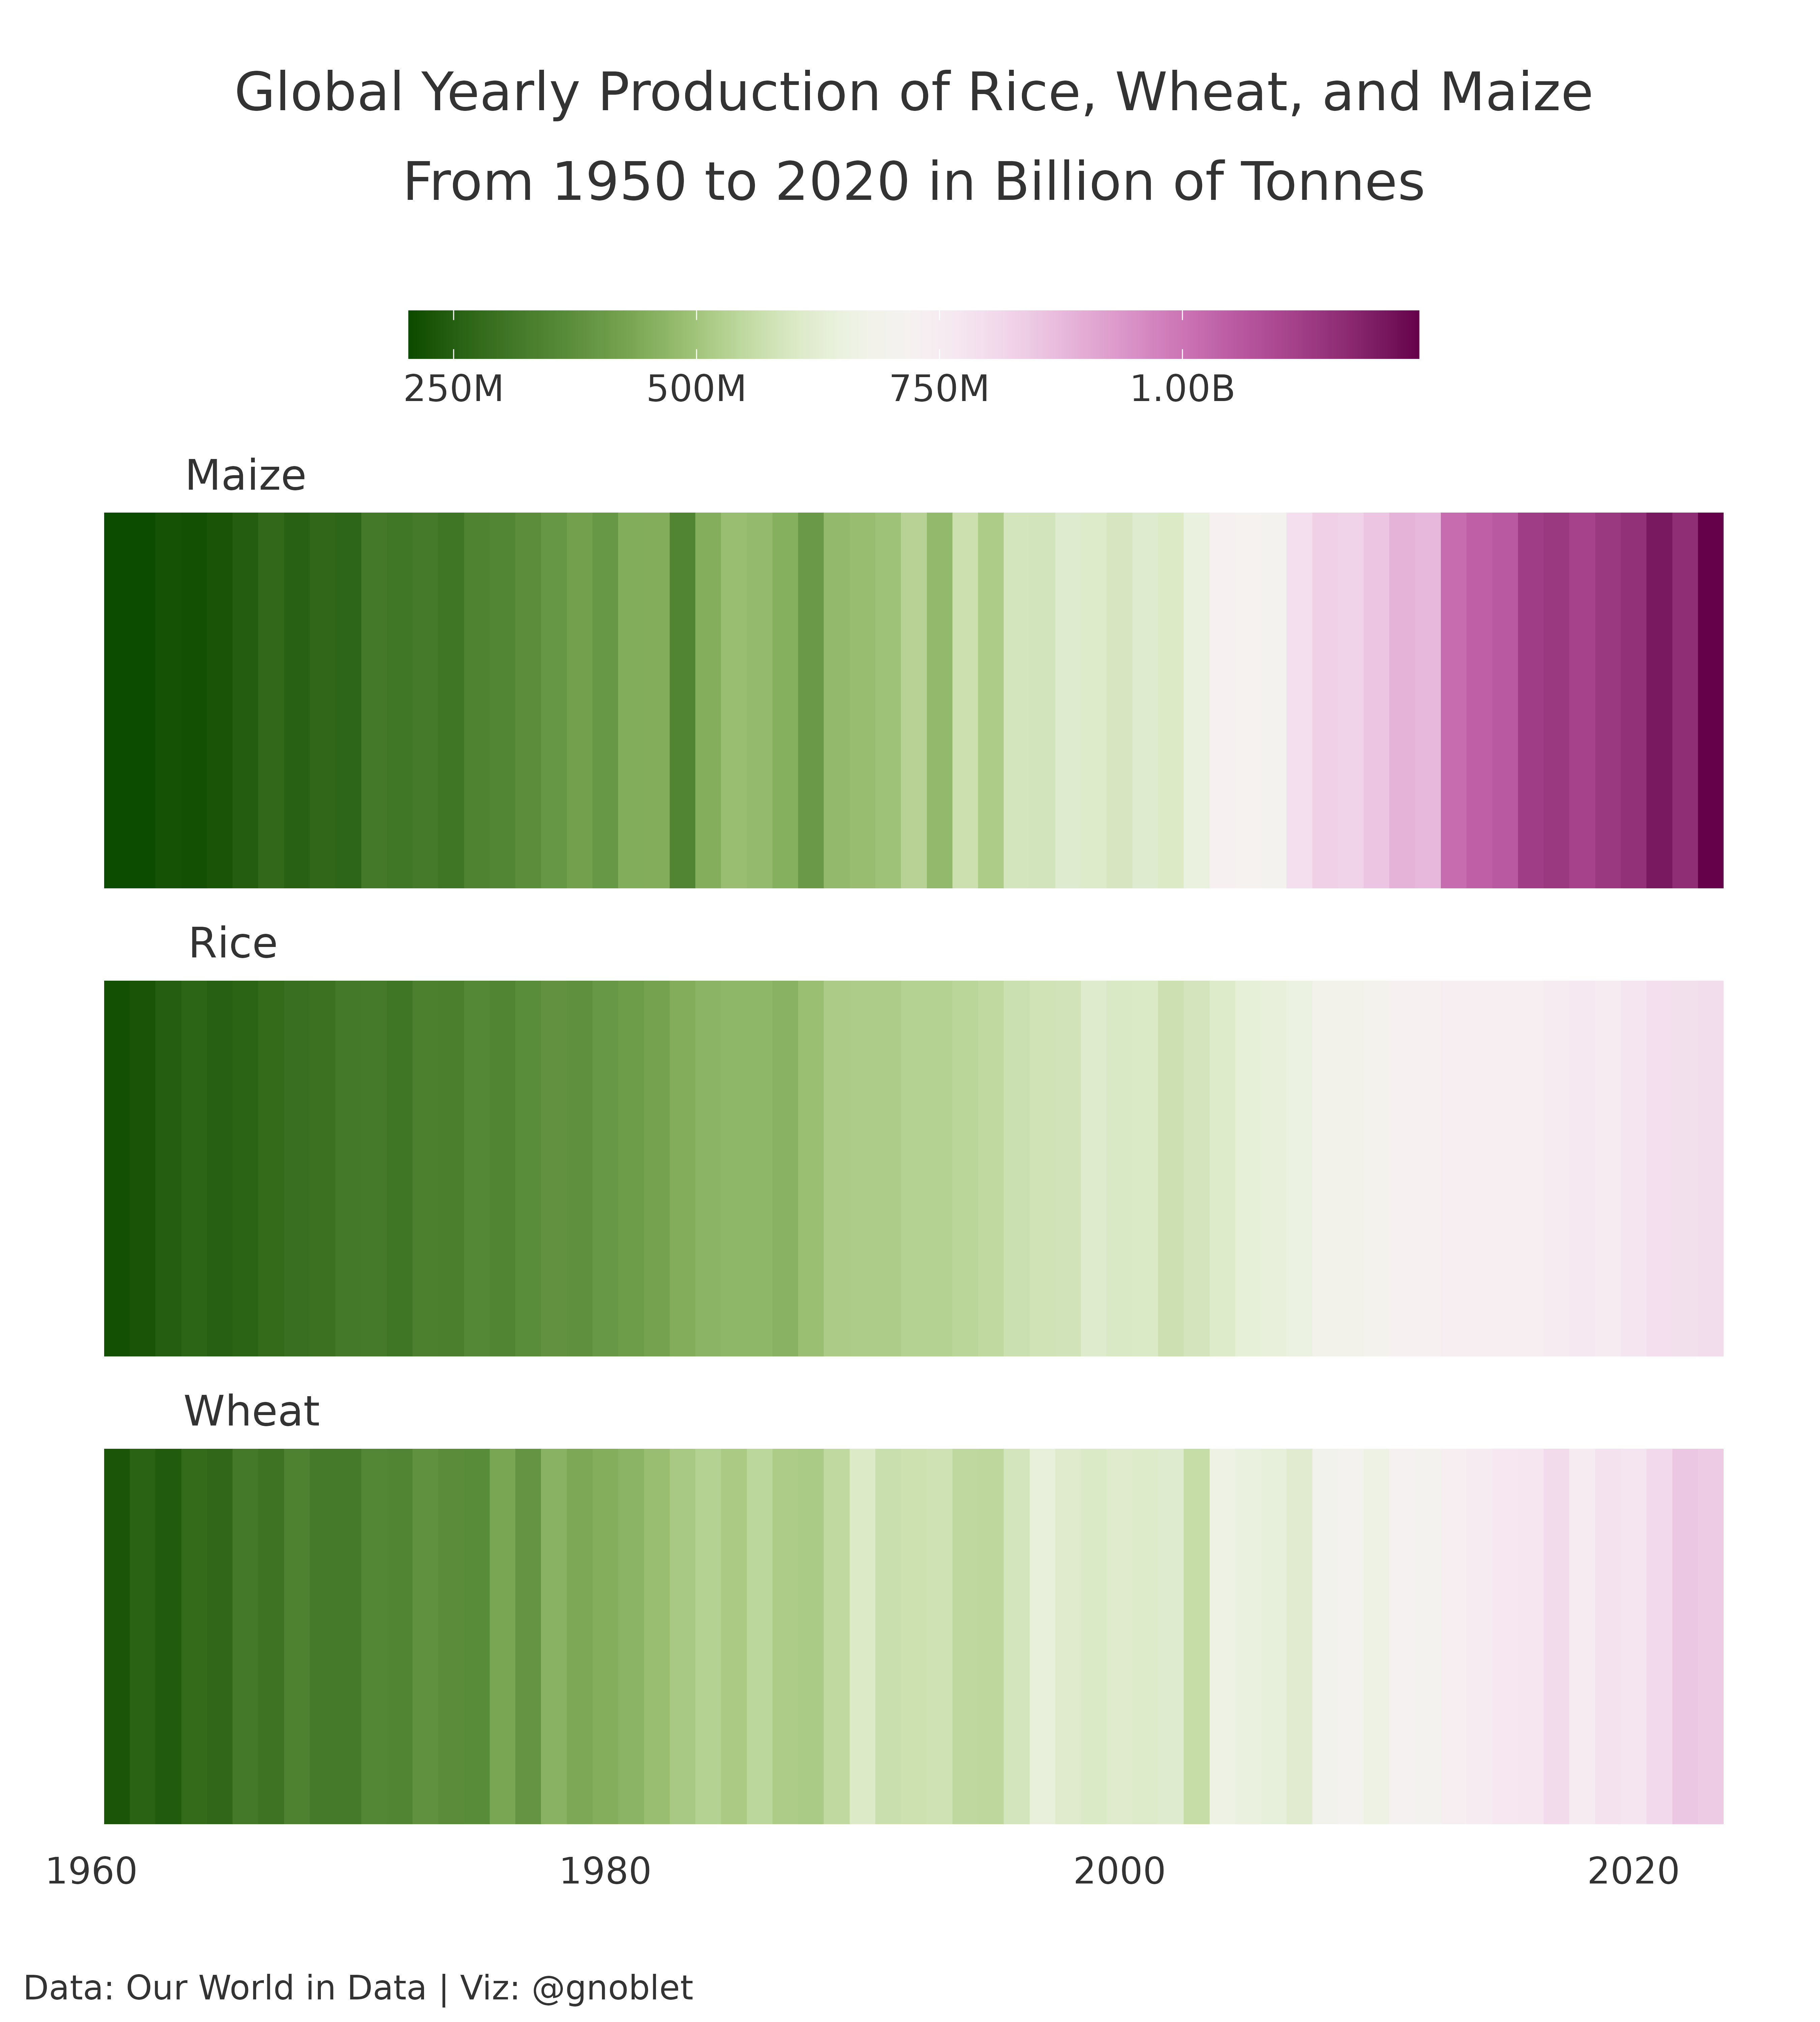
This visualization displays global yearly production trends for three major cereal crops (rice, wheat, and maize) using stripe plots.
Data source: Our World in Data - Agricultural Production
Tools used:
owidapi (for retrieving agricultural production data)
data.table (for efficient data manipulation)
ggplot2 (for visualization)
ggtext (for rich text formatting)
paletteer (for accessing the scico color palette)
The visualization uses a stripe-based approach where each horizontal band represents a crop type, and color intensity indicates production volume. This format allows for easy comparison of production trends across crops and time periods. The “bam” color palette from the scico package provides clear differentiation between low and high production years while remaining visually cohesive.