library(rio)library(data.table)library(ggplot2)library(ggtext)library(refugees)library(gghighlight)library(paletteer)# get population datadat <- refugees::populationsetDT(dat)# sum total number of refugees per yeardat_sum_year <- dat[,lapply(.SD, function(x) sum(x, na.rm =TRUE)), .SDcols =c("refugees", "asylum_seekers", "returned_refugees", "idps", "returned_idps", "stateless"), by = .(year)]# add column of totaldat_sum_year[, all_pop := refugees + asylum_seekers + returned_refugees + idps + returned_idps + stateless]# melt to longdat_sum_year_long <-melt( dat_sum_year,variable.name ="pop_type",value.name ="n",id.vars =c("year"))# recoding categoriescat <-c("refugees"="Refugees","asylum_seekers"="Asylum Seekers","returned_refugees"="Returned Refugees","idps"="IDPs","returned_idps"="Returned IDPs","stateless"="Stateless","all_pop"="Total")dat_sum_year_long[, pop_type :=factor(pop_type, levels =names(cat), labels = cat)]# plot g <-ggplot(dat_sum_year_long[pop_type !="Total"],aes(x = year, y = n, group = pop_type, color = pop_type)) +geom_line(size =1) +gghighlight(pop_type %in%c("Refugees", "IDPs"),use_direct_label =TRUE,unhighlighted_params =list(color ="gray60", size =0.2)) +theme_dark(base_size =14) +scale_color_manual(values =c("Refugees"="#00B4D8","IDPs"="#FF3D7F" )) +scale_y_continuous(labels = scales::label_number(scale_cut = scales::cut_short_scale()),breaks = scales::breaks_extended(8) ) +# x scale with dates every 10 yearsscale_x_continuous(breaks =seq(1950, 2025, 10),limits =c(1950, 2025) ) +# vline in 2015geom_segment(x =2016,xend =2016,y =-4e6,yend =7.2e7,color ="#FFD700",linetype ="dashed",size =0.3 ) +annotate(geom ="text",x =2016,y =7.4e7,label ="2016 Grand Bargain",color ="#FFD700", ) +geom_segment(x =2005,xend =2005,y =-4e6,yend =7.2e7,color ="#FFD700",linetype ="dashed",size =0.3 ) +annotate(geom ="text",x =2005,y =7.4e7,label ="2005 reform",color ="#FFD700" ) +labs(title ="NULL",x =NULL,y =NULL ) +theme(plot.title =element_text(color ="#FF6F61", size =18, hjust =0,margin =margin(b =20, l =-50)),plot.title.position ="plot",panel.background =element_rect(fill ="gray10"),plot.background =element_rect(fill ="gray10"),panel.grid.major =element_line(color ="gray25"),panel.grid.minor =element_blank(),axis.text =element_text(color ="white"),axis.line =element_line(color ="white") ) +geom_textbox(aes(x =1955, y =6.6e7),label ="<span style='color:#FFD700;font-size:28pt;'>Global Displacement Trends</span><br> <span style='color:#FFC300;font-size:18pt;'>Refugees and IDPs (1951-2024)</span><br><br> <span style='color:#FFFFFF;font-size:12pt;'> Internally Displaced Persons (IDPs) have been forced to flee their homes due to conflict, violence, persecution or disasters, remaining within their own country while refugees cross broders.<br><br> <span style='color:#FF3D7F'>IDPs</span> numbers show consistent growth since the mid-1990s. <span style='color:#00B4D8'>Refugees</span> figures exhibit periodic surges and a constant increase since the early-2000s.</i><br><br> Data collection and standardization efforts through reforms have improved displacement tracking.</span>",box.color =NA,fill =NA,width = grid::unit(0.5, "npc"),lineheight =1.4,hjust =0, vjust =1 )# saveggsave("day_02.png",height =9,width =11,dpi =600,type ="cairo-png")
Final Plot
Notes
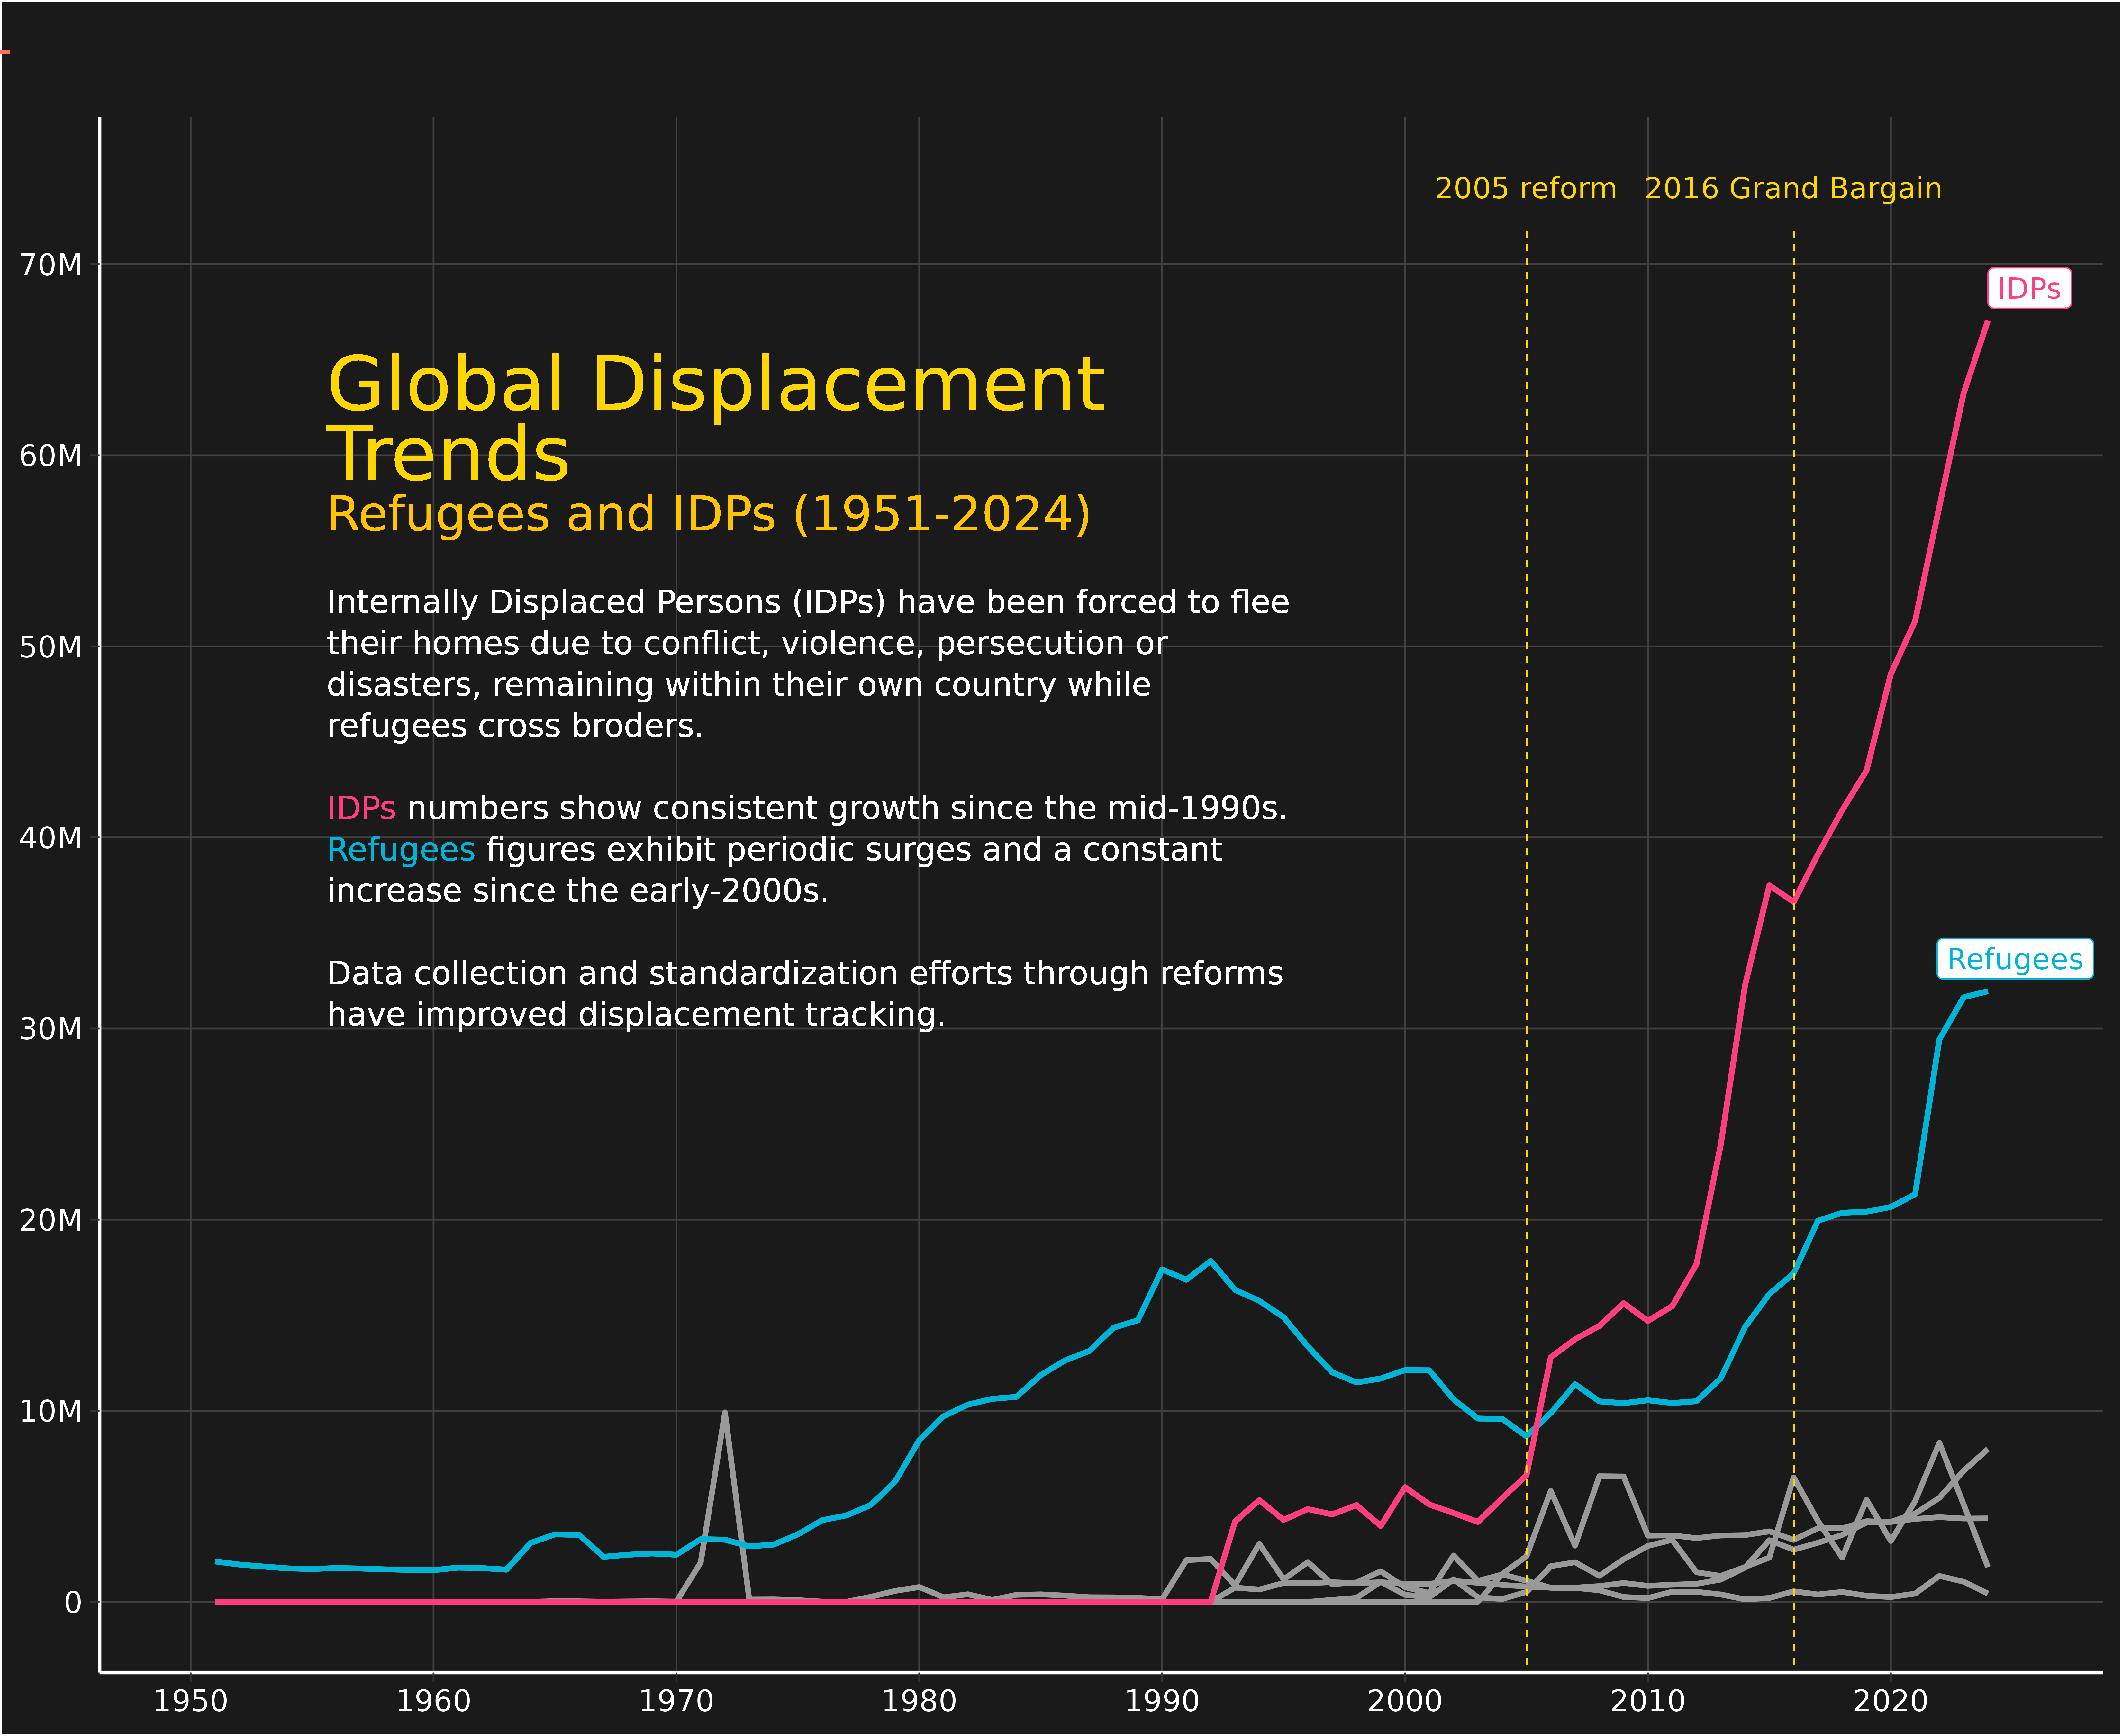
This visualization tracks global displacement trends from 1951 to 2024, focusing on refugees and internally displaced persons (IDPs). The dark theme emphasizes the serious nature of the subject matter.
Data source: UNHCR Refugee Data Finder (accessed via the refugees R package)
The visualization highlights significant policy moments with vertical markers (2005 reform and 2016 Grand Bargain) and uses contrasting colors to distinguish between IDPs (pink) and refugees (blue). The chart reveals the concerning upward trend in both refugee and IDP numbers over recent decades, with IDPs consistently outpacing refugee numbers since the mid-1990s.